
Welcome back to the GifHow, where we transform everyday software struggles into moments of pure “aha!” You’ve been on an incredible journey with us, exploring the vast capabilities of Microsoft Excel, and guess what? We’re only just getting warmed up! If you’ve been following our “40 Excel Tips” series, you know that Excel is far more than just a grid of cells; it’s a dynamic platform for analysis, visualization, and unparalleled productivity.
In Parts 1 and 2, we laid some serious groundwork. Now, in Part 3, we’re ready to delve even deeper, unveiling another set of 10 game-changing techniques that will elevate your Excel skills from proficient to phenomenal. Are you ready to make your data sing, automate tedious tasks, and present your information with more clarity and impact than ever before? Of course, you are! So, grab your virtual notepad, fire up Excel, and let’s dive into the next chapter of your spreadsheet mastery!
21. Slice Into Some Data: Your Interactive Filter Friend
Ever feel like you’re drowning in a sea of data within your tables or PivotTables? Trying to manually filter and re-filter to find specific insights can be a real time-sink. What if you could have an intuitive, visual way to dice through your data with just a few clicks?
Enter the Slicer. This nifty tool acts like a set of interactive buttons for your data.
Here’s how to bring this magic to your worksheets:
- Click anywhere inside your formatted table or PivotTable.
- Navigate to the Insert tab on the Excel ribbon and select Slicer. (Alternatively, for PivotTables, you can find it on the PivotTable Analyze menu by tapping Insert Slicer, or simply right-click an entry in the PivotTable fields and choose Slicer.)
- A dialog box will pop up, listing the fields from your table. Pick the data point(s) you want to filter by (e.g., “Region,” “Product Category,” “Month”).
- A floating menu (your slicer) appears for each selected field. Click on items within the slicer to instantly filter your table or PivotTable.
- Want to select multiple items in a slicer? Just hold down the Ctrl key while clicking.
- To clear your selections quickly, click the “funnel with a slash” icon at the top right of the slicer.
- You can customize your slicer’s appearance and behavior using the dedicated Slicer tab that appears when a slicer is selected. You can even right-click the slicer, go to Slicer Settings, and uncheck “Display Header” if you prefer a cleaner look.
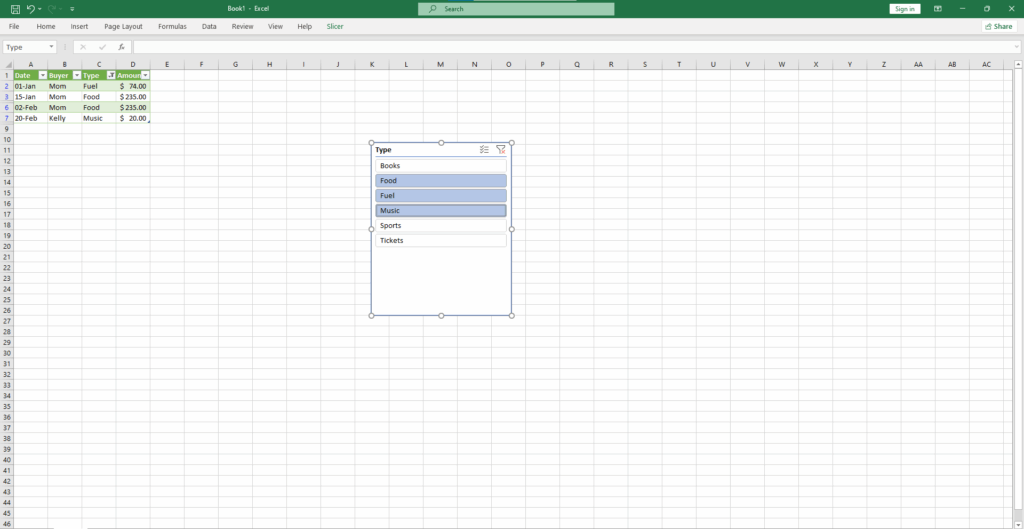
Slicers make data exploration dynamic and incredibly user-friendly, especially when sharing workbooks with others.
22. Perform Quick Analysis: Instant Insights at Your Fingertips
Sometimes you have a range of data, and you know there’s something interesting in there, but you’re not quite sure what chart to use, what formatting to apply, or what calculation to perform. Excel’s Quick Analysis tool is like having a helpful assistant ready to suggest options.
Unlock instant data wisdom like this:
- Select the range of data you want to analyze.
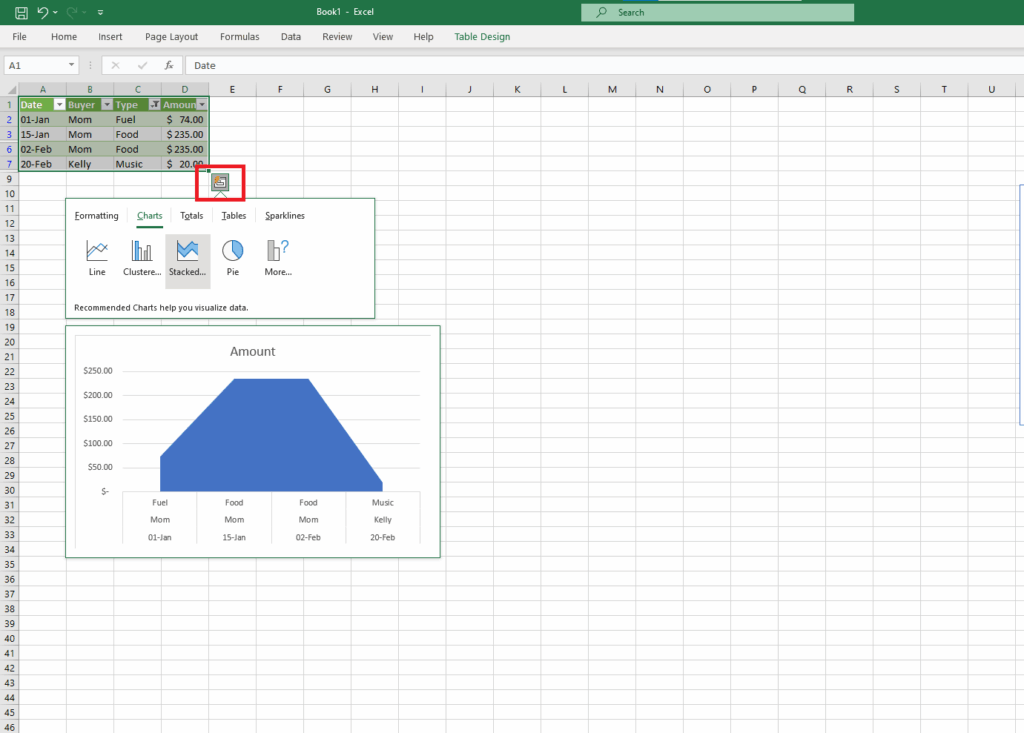
- Look for the small Quick Analysis box that appears at the lower-right corner of your selection. Click it.
- A menu will pop up offering several categories: Formatting, Charts, Totals, Tables, and Sparklines.
- Hover over the options within these categories to see a live preview of how they would apply to your selected data.
- Click an option to apply it instantly. It’s a fantastic way to experiment and quickly find the best way to represent your information.
23. Quickly Customize Your Data Table: Style It Your Way
Raw data in rows and columns can be a bit bland and hard to read. Transforming it into a formatted Excel Table not only makes it look better but also unlocks powerful features like structured references, easy sorting, and filtering. While Quick Analysis can get you there, sometimes you want more control over the aesthetics.
Give your tables a makeover with these steps:
- Select your range of data.
- Go to the Home tab.
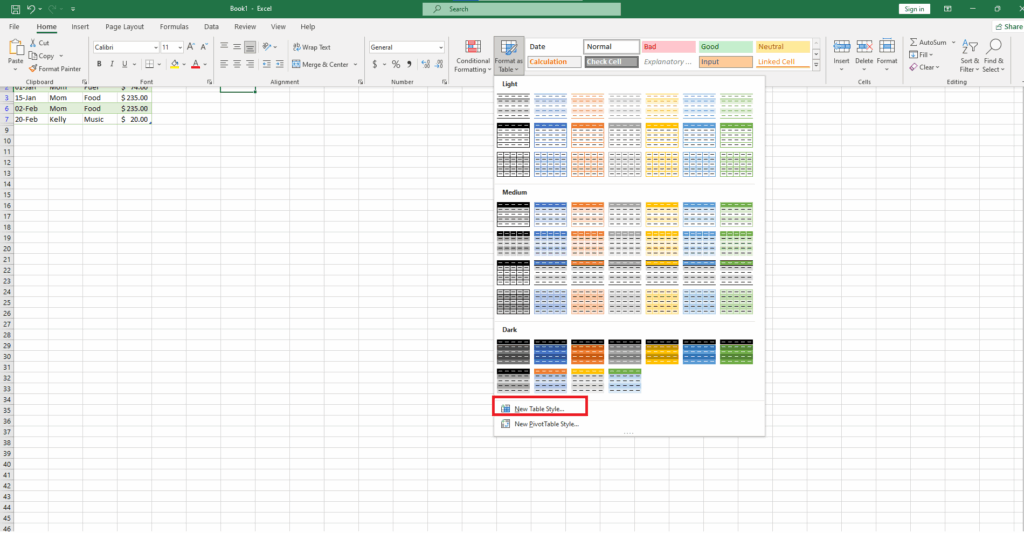
- Click on Format as Table. You’ll see a gallery of pre-designed table styles – from light and airy to dark and bold, with options for header rows, banded rows, and more.
- Choose a style that suits your needs and click it. Confirm if your table has headers.
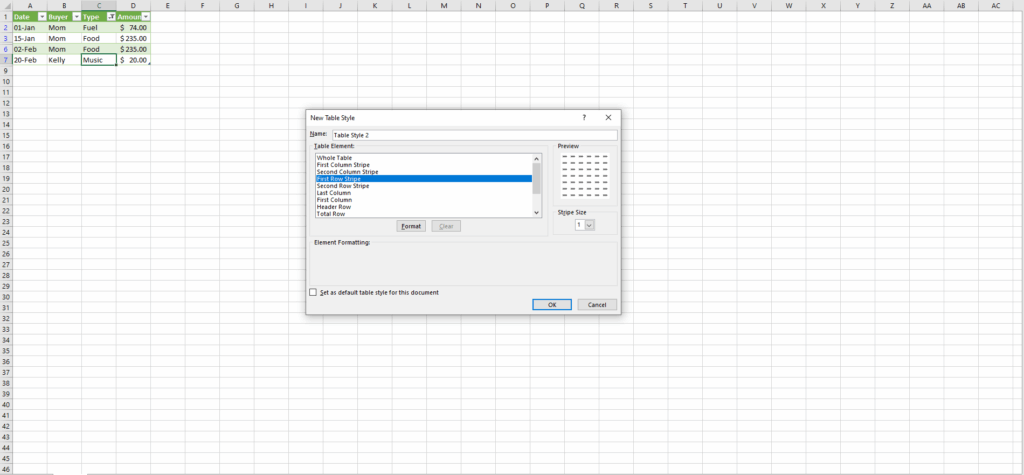
- Want something truly unique? In the Format as Table dropdown, select New Table Style. This opens a dialog where you can create and name your very own custom table design, which will then appear under a “Custom” banner in the styles menu for future use.
Follow How To Create Dropdown List in Excel | Gif.How here - Pro Tip: Don’t care much for fancy styles but want table functionality ASAP? Select your data and press Ctrl+T. Bam! Instant table.
24. Validate Data to Make Drop-Downs: Keep Your Data Clean and Consistent
When you’re creating a spreadsheet that others will use for data entry, you want to ensure accuracy and consistency. One of the best ways to do this is by limiting what users can enter into specific cells, often by providing a pre-defined list of options – a drop-down menu!
Here’s how to implement this control measure:
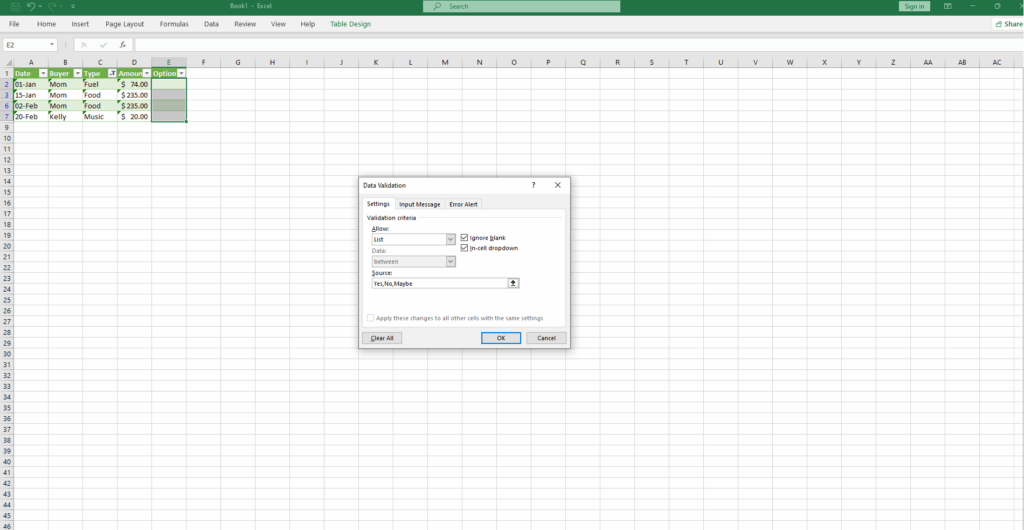
- Select the cell (or cells) where you want the drop-down menu to appear.
- Go to the Data tab and click on Data Validation.
- In the Data Validation dialog box, under the Settings tab, find the “Allow:” dropdown and select List.
- In the “Source:” field, you have two main options:
- Type directly: Enter your list items separated by commas (e.g.,
Yes,No,Maybe). This is good for short, static lists. - Reference a range: Click the small button with an upward arrow next to the “Source:” field. This allows you to select a range of cells elsewhere in your worksheet (or even another sheet) that contains your list items. This is the best method for longer or dynamic lists. You can even hide the columns/rows containing this source list later, and the drop-down will still work perfectly.
- Type directly: Enter your list items separated by commas (e.g.,
- Click OK. Your selected cell(s) will now have a drop-down arrow when clicked.
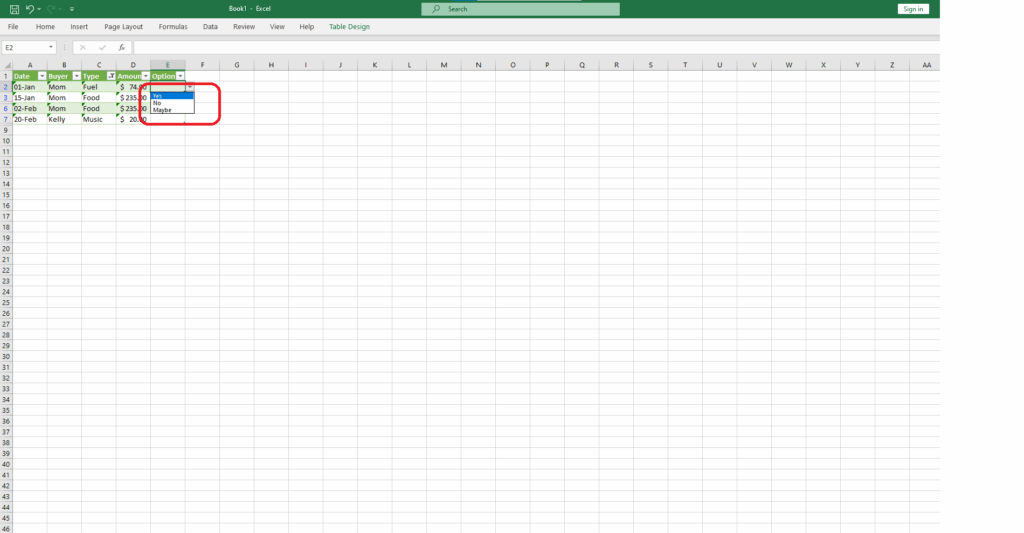
Data Validation isn’t just for lists! You can use it to restrict entries to whole numbers, decimals, dates within a specific range, text of a certain length, and even create custom input messages and error alerts to guide your users.
25. Conditionally Format Tables: Let Your Data Tell Its Story Visually
Staring at a massive table of numbers can be overwhelming. How do you quickly spot the highest sales, the lowest scores, or identify trends? Conditional Formatting is your answer, transforming your data into a visual story.
Make your data stand out with these techniques:
- Select the cells or table you want to format.
- On the Home tab, click Conditional Formatting.
- Explore the various options:
- Highlight Cells Rules: Find cells greater than, less than, between certain values, containing specific text, duplicate values, etc.
- Top/Bottom Rules: Instantly highlight the top 10 items, bottom 5 percent, values above average, and so on.
- Data Bars: Adds a small bar graph within each cell, making it easy to compare values visually.
- Color Scales: Applies a gradient of colors across your selected cells, with different shades representing different value levels (e.g., green for high, red for low).
- Icon Sets: Inserts small icons (like arrows, traffic lights, or stars) into cells based on their values.
- Choose a rule type and then specify the criteria. Excel will automatically apply the formatting, making key data points jump off the page.
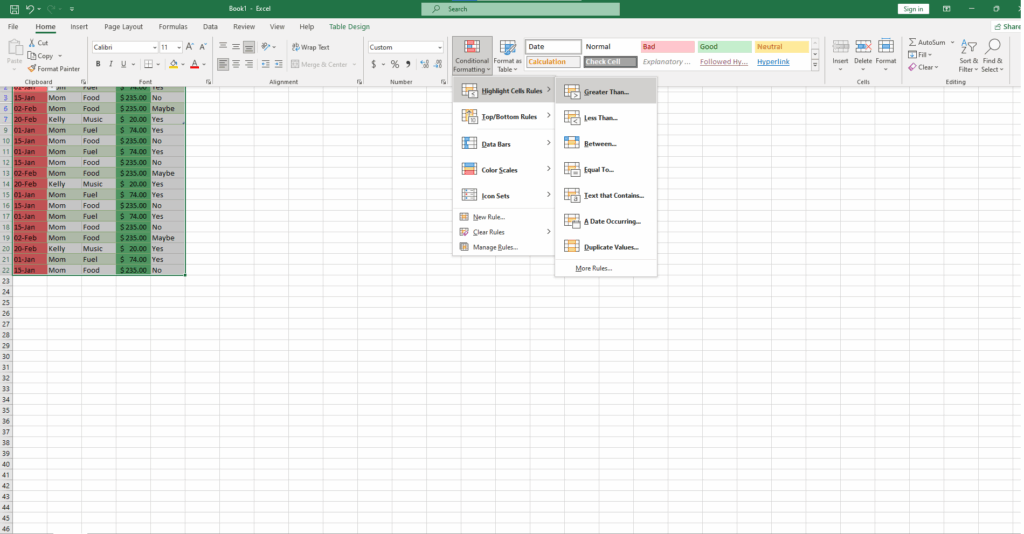
Don’t be afraid to layer multiple conditional formatting rules to create truly insightful dashboards right within your cells.
26. Screenshot Insertion: Effortless Visuals for Your Worksheets
Sometimes, words and numbers aren’t enough. You might need to include a visual from another application or a website directly into your Excel sheet for reference or explanation. Excel makes this incredibly straightforward.
Here’s how to quickly grab and insert visuals:
- Make sure the program or window you want to capture is open on your desktop.
- In Excel, go to the Insert tab.
- Click on Screenshot.
- A dropdown menu will appear, showing thumbnails of all your currently open windows.
- Simply click on the thumbnail of the window you want to insert. The full-size image will be placed into your worksheet.
- You can then resize, move, and format the inserted image as needed.
This is perfect for adding context, instructions, or visual evidence to your spreadsheets.
27. Pull Data from Pictures: From Image to Insight in Seconds!
Imagine you have a printed table of data, or perhaps you’ve found a table embedded in an image online. The thought of manually retyping all that information into Excel is enough to make anyone sigh. But what if Excel could “read” the data from the picture for you?
Yes, it’s possible with the “Data from Picture” feature!
Transform pictures into editable data:
- Go to the Data tab on the ribbon.
- In the “Get & Transform Data” group, click From Picture.
- You’ll have two options:
- Picture From File: If you have an image file (e.g., JPG, PNG) saved on your computer, select this and browse to your image.
- Picture From Clipboard: If you’ve taken a screenshot (e.g., using
Windows Key + Shift + S) of a table on a website or in another document and it’s on your clipboard, choose this.
- A “Data from Picture” pane will appear on the right. Excel will analyze the image in real-time.
- Once the analysis is complete, Excel will show you a preview of the data it extracted, highlighting any values it’s unsure about. You’ll have a chance to review and correct these.
- Click Insert Data, and the recognized data will be placed into your worksheet.
While not always 100% perfect, especially with complex or low-quality images, this feature can be a massive time-saver!
28. Insert Excel Data Into Word or PowerPoint: Seamless Integration
Back in the day, moving data between Office applications felt like a complex technical feat. Now, sharing your meticulously crafted Excel tables or charts in your Word documents or PowerPoint presentations is a breeze.
Here’s the lowdown on linking and embedding:
- Copying from Excel: Select the cells, table, or chart in Excel that you want to use. Press Ctrl+C (or right-click and Copy).
- Pasting into Word/PowerPoint (Linked):
- Go to your Word document or PowerPoint slide.
- Right-click where you want to insert the data and look for Paste Options. You’ll typically see options like “Keep Source Formatting & Link Data” or “Use Destination Styles & Link Data.”
- Choosing a linked option means that if you update the data in your original Excel spreadsheet, the changes will automatically reflect in your Word document or PowerPoint presentation (you might need to right-click and select “Update Link”).
- Pasting as a Picture (Static):
- If you don’t want the data to update and prefer a static image, Excel offers a direct way: After selecting your data in Excel, go to the Home tab, click the arrow below the Copy button, and choose Copy as Picture. Then, you can paste this image into any application.
- Alternatively, in Word/PowerPoint, use the Paste Special command (often found by clicking the arrow under the Paste button or via right-click). In the Paste Special dialog, you can choose to paste as a “Picture (Enhanced Metafile)” or other image formats for a non-linked, static graphic.
This flexibility allows you to present your Excel insights effectively, wherever they’re needed.
29. Use a Dollar Sign ($) to Prevent Shift: Mastering Absolute References
When you write a formula in Excel, you usually refer to cells by their position (e.g., A1). If you copy that formula and paste it into another cell, Excel cleverly adjusts the cell references. For example, if you copy a formula referencing A1 from cell B1 down to B2, the formula in B2 will now reference A2. This is called a relative reference and is usually what you want.
But what if you don’t want a reference to change when you copy a formula? That’s where the mighty dollar sign ($) comes in, creating an absolute reference.
Lock your cell references like this:
$A1: The column (A) is absolute, but the row (1) is relative. If you copy this formula sideways, theAwon’t change. If you copy it up or down, the1will change.A$1: The column (A) is relative, but the row (1) is absolute. If you copy this formula sideways, theAwill change. If you copy it up or down, the1won’t change.$A$1: Both the column (A) and the row (1) are absolute. No matter where you copy this formula, it will always refer to cellA1.
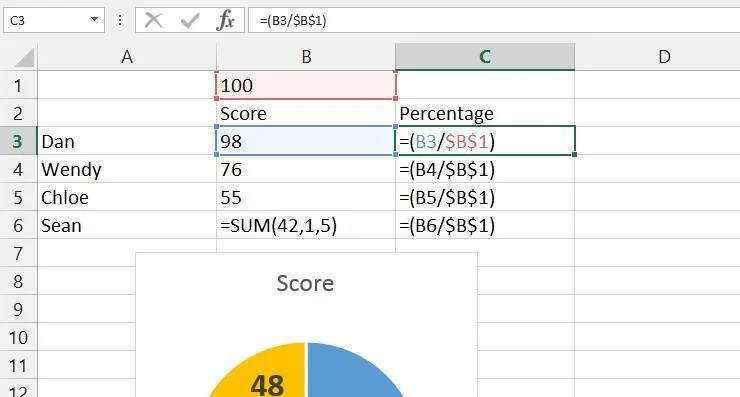
Why is this so handy? Imagine you have a sales tax rate in cell B1 (e.g., 7%). You want to calculate the sales tax for a list of prices in column A. Your formula for the first price (in A2) might be =A2*B1. If you drag this formula down, it will become =A3*B2, then =A4*B3, which is wrong because the tax rate is only in B1. The solution is to use an absolute reference for the tax rate cell: =A2*$B$1. Now, when you copy this formula down, it becomes =A3*$B$1, =A4*$B$1, and so on. The reference to B1 remains constant, giving you the correct calculation every time. You can then easily change the tax rate in cell B1, and all your calculations will update instantly!
30. Great Excel Shortcut Keys: Your Expressway to Efficiency
Who doesn’t love a good shortcut? Mastering keyboard shortcuts in Excel can dramatically speed up your workflow, turning repetitive tasks into split-second actions. While there are hundreds, here are some fan favorites to get you started:
- Ctrl+; — Inserts today’s date in the active cell.
- Ctrl+Shift+: (colon) — Inserts the current time in the active cell.
- Ctrl+Shift+# (hash/pound) — Changes the format of a selected date.
- Ctrl+5 — Applies or removes strikethrough formatting to text in a cell.
- Ctrl+0 (zero) — Hides the current column(s).
- Ctrl+9 — Hides the current row(s).
- Ctrl+F6 — Switches between open Excel workbooks (different Excel files).
- Ctrl+` (accent grave – usually next to the 1 key) — Toggles the display to show all formulas in the sheet or their resulting values. A lifesaver for debugging!
- Ctrl+PageUp or Ctrl+PageDown — Quickly navigates between the worksheets in your currently open workbook.
- F2 — Starts editing the currently selected cell. Much faster than double-clicking!
- Shift+F10 — Opens the right-click context menu for the current selection (just like a right-click).
- Shift+F2 — Allows you to add or edit a comment in the selected cell.
- Ctrl+Shift+V — This is often a custom or newer shortcut for “Paste Values.” If it doesn’t work natively, you might need to use the classic
Alt+E, S, V, Entersequence or right-click > Paste Special > Values. It pastes whatever you copied as its final value, stripping away any formulas. (Standard Ctrl+V would paste the formula itself.) - Ctrl+T — Select any cell within your data range, press this, and Excel instantly transforms your data into a formatted Table.
Start by incorporating a few of these into your daily Excel routine, and you’ll be flying through your tasks in no time!
Phew! That’s another 10 powerful Excel tips under your belt. Take a moment to let these sink in, and more importantly, try them out! The real magic happens when you apply this knowledge to your own projects.
We’re thrilled you’re on this learning adventure with us at GifHow. Stay tuned, because we still have 10 more tips coming your way in Part 4 to complete our ultimate Excel power-up!
Which of these tips are you most excited to try? Do you have a favorite Excel trick from this list that has already saved you time? Share your thoughts in the comments below!


